Get started with Legacy Metrics
Learn about the Legacy Metrics tool, which can help you to gain insights into how your content is performing.
Info
This feature has been replaced by Uberflip Analytics, and is now considered a legacy feature. Legacy features are no longer supported, but still remain available to some users.
The feature formerly called Hub Metrics is now officially known as Legacy Metrics. This feature is no longer shown on new Uberflip accounts created in or after June 2020.
Before you Begin
- To access Hub Metrics, you need to be an Account Admin, Content Manager, or Analyst.
What is Legacy Metrics?
Your Uberflip Hub comes with a built-in Legacy Metrics tool. As the name suggests, this tool collects and displays metrics for your Hub. A metric is any quantifiable measure that can be used to track performance, and in the context of your Hub, this refers to the performance of your Hub content.
Legacy Metrics shows you exactly how your prospects and customers are engaging with your content, and can help you to understand what resonates with them — and what doesn't. By leveraging these insights, you can shape your content to optimize it for your audience, which can help you to get more value from it.
What Metrics are Tracked?
Legacy Metrics tracks a number of key statistics related to your Hub visitors and their behavior. This ranges from raw stats like the number of visitors in a given period to calculated metrics like CTA Conversions (which measures the effectiveness of CTAs).
Legacy Metrics divides the metrics it records into Hub-specific data and Flipbooks-specific data. You can find a list of all the different metrics that are tracked, along with an explanation of what each one means, in this article.
Open Legacy Metrics
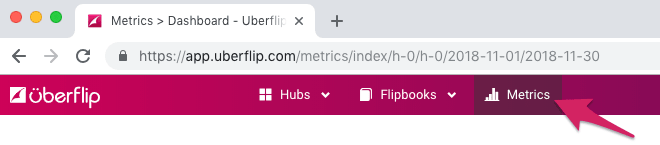
You can view Legacy Metrics at any time by simply clicking on the Metrics button in the menu bar at the top of the Uberflip app:
Clicking on Metrics will display the Dashboard:
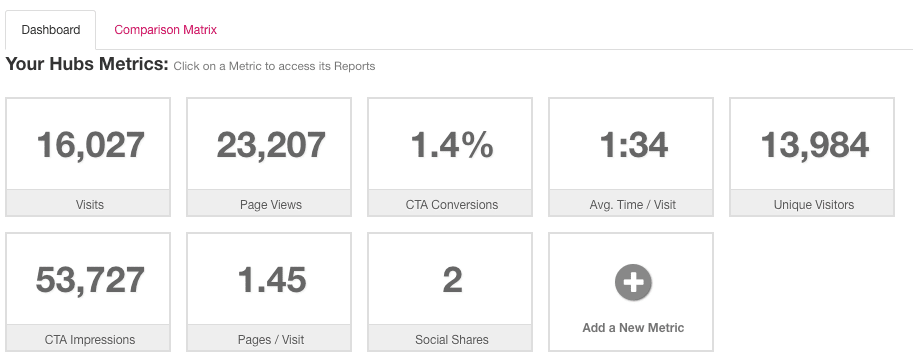
This is the default view, which provides an at-a-glance overview of the various metrics available. From here, you can:
- Set the type/scope and reporting period for the metrics
- Drill down into specific metrics to view further details and more granular data
- Customize the Dashboard
- Access other tools and settings (view comparisons, exclude IP addresses, email reports)
Filter Metrics
All the data shown within Legacy Metrics is controlled by two settings, which filter the data by type and scope, and set the reporting period. Both of these settings are global, so they apply to all views within the Legacy Metrics tool (e.g. if you drill into a metric), and can be changed from any view.
Set Metrics Type and Scope
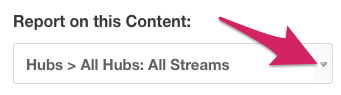
Click on the Report on this Content dropdown to choose the type and scope of the data you want to view.
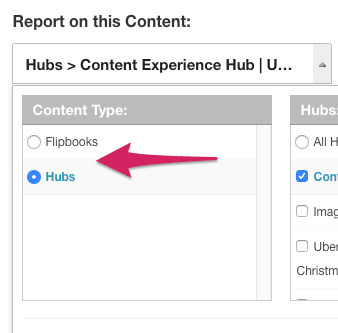
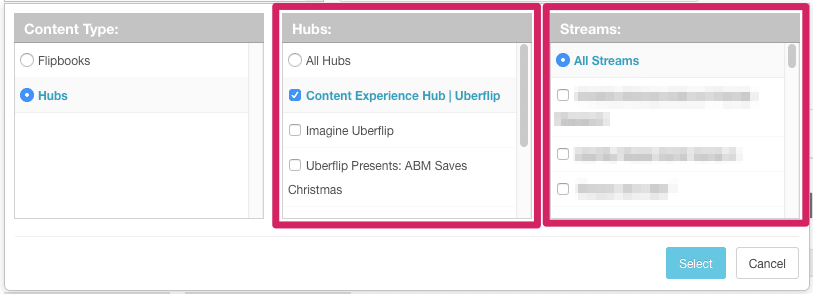
This dropdown is split into three sections. In the first (left-most) section, use Content Type to choose between Hub-specific metrics and Flipbooks-specific metrics:
Based on your selection, the other two sections in the dropdown will allow you to narrow down the data displayed to either:
- Hubs: One or more specific Hubs, and further to one or more specific Streams within the selected Hub(s):
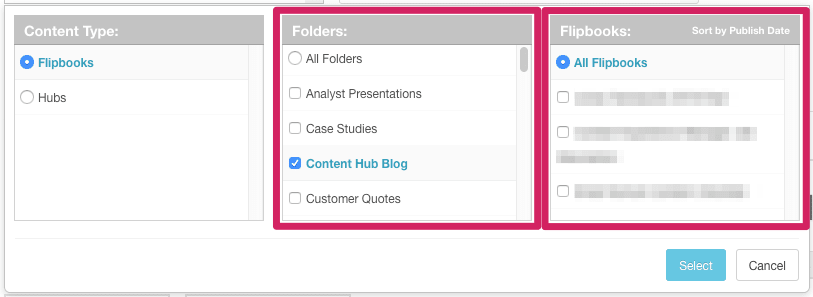
- Flipbooks: One or more specific Folders, and further to one or more specific Flipbooks within the selected Folder(s):
When you have made your selections, click on the Select button to apply them.
Set Metrics Reporting Period
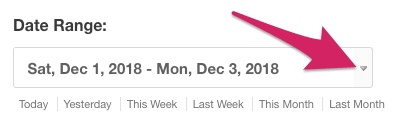
Click on the Date Range dropdown to set the reporting period.
Use the date pickers under Date From and Date To to specify a range of time for which you want to view data.
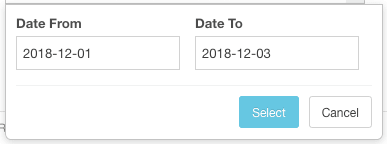
When you have made your selections, click on the Select button to apply them.
Alternatively, you can also click on the reporting period shortcuts under the dropdown to quickly set a predefined, relative reporting period:
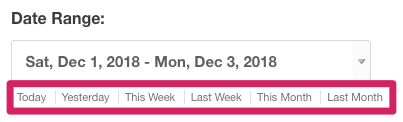
When you click on one of these shortcuts, the reporting period will be set immediately (no need to click on Select).
Drill Down Into Metrics and View Reports
You can drill down into any metric by simply clicking on its tile in the Dashboard:
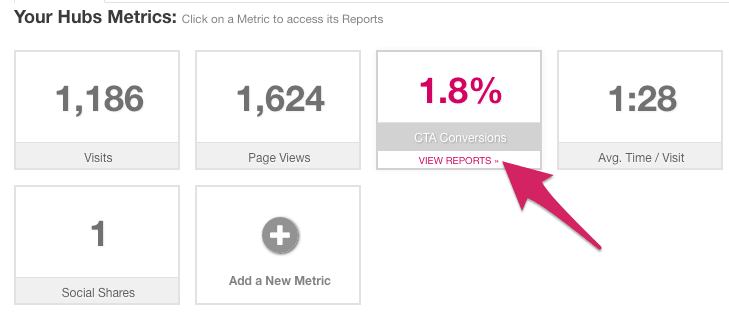
This will open up the Reports view, where you can see a number of different reports for that specific metric, accessible via separate tabs:
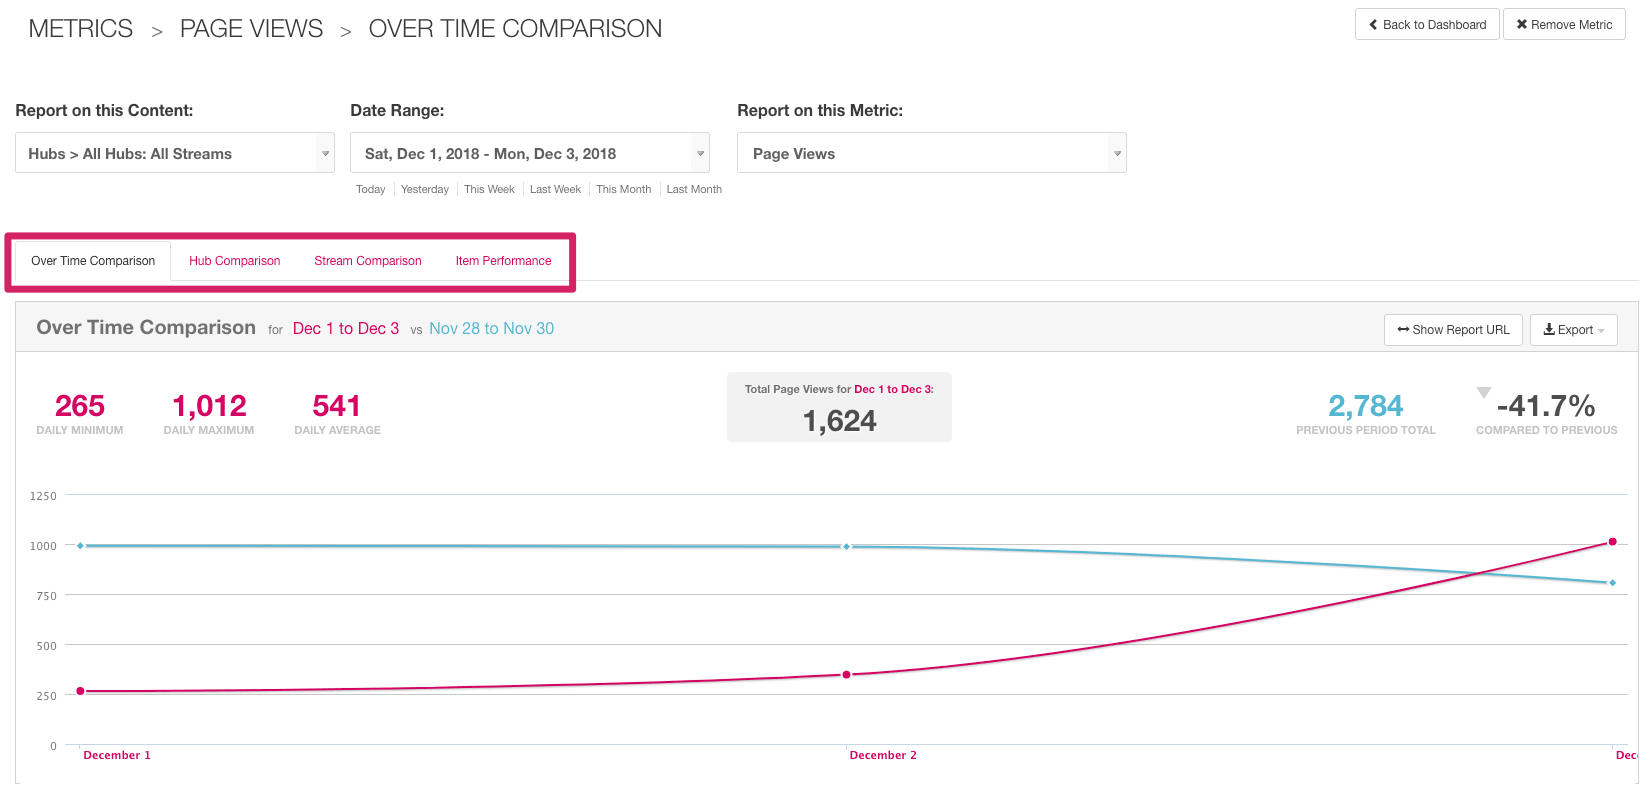
You can also export the report you are viewing by using the Export button in the top right, which allows you to download the report data in CSV format.
Customize the Metrics Dashboard
By default, your Metrics Dashboard will display a preset list of metrics. If you prefer, you can customize the Dashboard by adding, removing and rearranging metrics.
Add A Metric
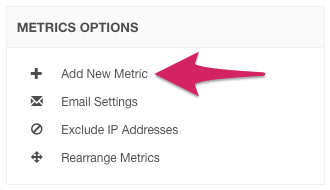
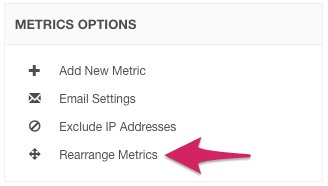
To add a metric to the Dashboard, click on Add New Metric in the Metrics Options box on the right:
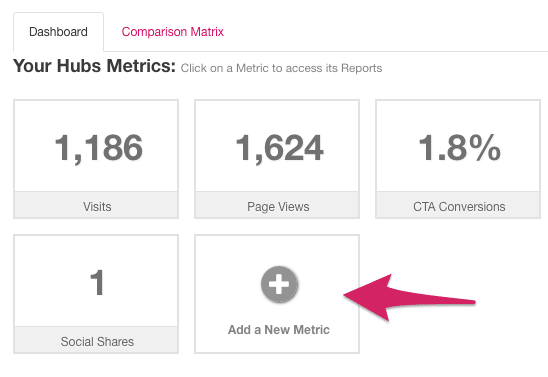
Or, you can click on the Add a New Metric tile in the Dashboard itself:
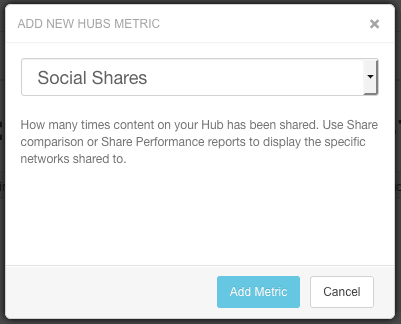
The Add New Metric menu will appear. Use the dropdown to select a new metric to add, then click on the Add Metric button:
The new metric will be added to the Dashboard.
Rearrange and Remove Metrics
Metrics will appear in your Dashboard in a preset order, but you can easily change the order to suit your preference. Simply click on Rearrange Metrics in the Metrics Options box on the right:
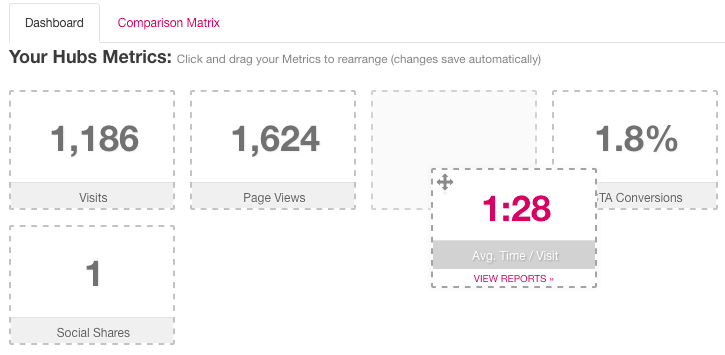
The borders of your metrics tiles will now become dashed, and you can drag-and-drop tiles to rearrange them:
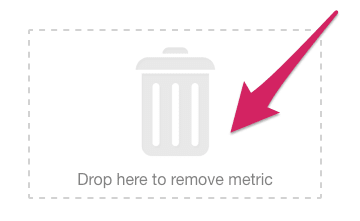
To remove a metric from the Dashboard, drag it over to the Drop here to remove metric area on the right:
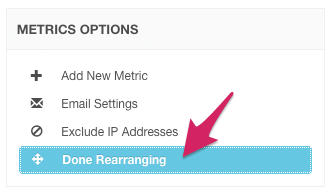
When you're finished rearranging or removing metrics from the Dashboard, click on Done Rearranging in the Metrics Options box.
View a Comparison Matrix
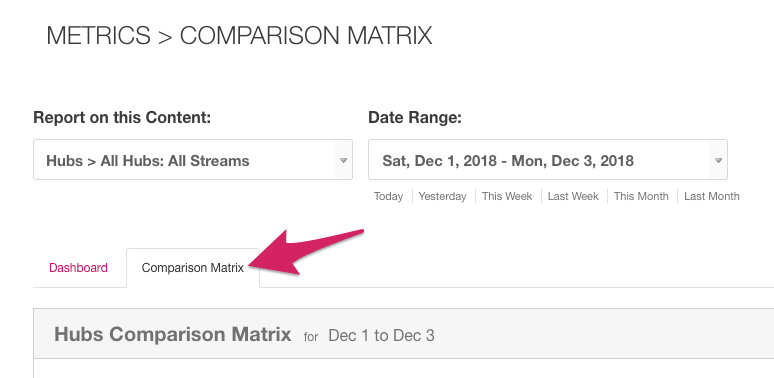
Aside from the Dashboard, you can also view the Comparison Matrix, an overview report that compares a selection of metrics across different Hubs, Streams, Folders, or Flipbooks. To view it, click on the Comparison Matrix tab, next to Dashboard:
As with all reports, this report is subject to the type/scope and reporting period filters.
Next Steps
Legacy Metrics also has built-in tools to exclude data from certain IP addresses from your metrics, as well as to automatically email sets of reports on a schedule. See the articles below to learn more:
In addition, Legacy Metrics is not the only place on your Hub where you can view metrics: there is also the Hub Dashboard, where you can find your Content Performance reports and the Sales Activity Dashboard. You can find more information in the article below: