The Sales Activity Dashboard Explained
Learn about the Sales Activity Dashboard, and what it can tell you about the performance of your Hub's sales enablement tools.
About the Sales Activity Dashboard
A major use case for your Hub is sales enablement: giving your Sales team the ability to leverage your Hub content during the sales cycle by sharing it via Sales Streams and the Uberflip Extensions. The Sales Activity Dashboard displays metrics around sales activity performed using these tools, and can provide you with valuable insight into how your sales enablement efforts are performing.
The metrics shown on the Sales Activity Dashboard are split into four categories:
- Overview
- Users
- Streams
- Items
You can find details about the metrics contained within each category, as well as what they mean, in the sections below.
There are also two ways to filter the available metrics. Both of these filter types are global, so they affect all metrics across all categories.
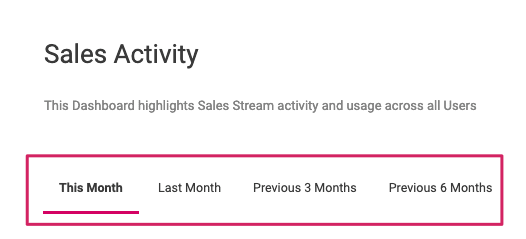
You can filter all metrics by date range using the selections along the top:
Info
Note that month in each of these options refers to calendar months. For example, if today is December 18th:
- This Month: Dec. 1 - Dec. 17
- Last Month: Nov. 1 - Nov. 30
- Previous 3 Months: Sept. 1 - Nov 30
- Previous 6 Months: June 1 - Nov. 30
In addition, you can also filter by user groups and group members to narrow your focus to specific teams or sales reps:
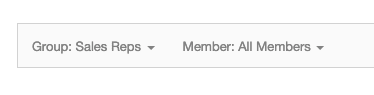
(When filtering by member, note that the dropdown will only show members in the currently selected group.)
Tip
As a best practice, we recommend creating custom user groups for each team in your sales organization (and assigning the appropriate users to each one). Doing this will allow you to easily break down metrics by team in the Sales Activity Dashboard.
These groups will primarily be used for filtering in the Sales Activity Dashboard, so you don't necessarily need to align them to your actual team structure. Instead, try to think about how you'd like to be able to break down your reporting, then create the groups necessary to accommodate this. Keep in mind as well that you can put any user into multiple groups, if needed.
Overview Metrics
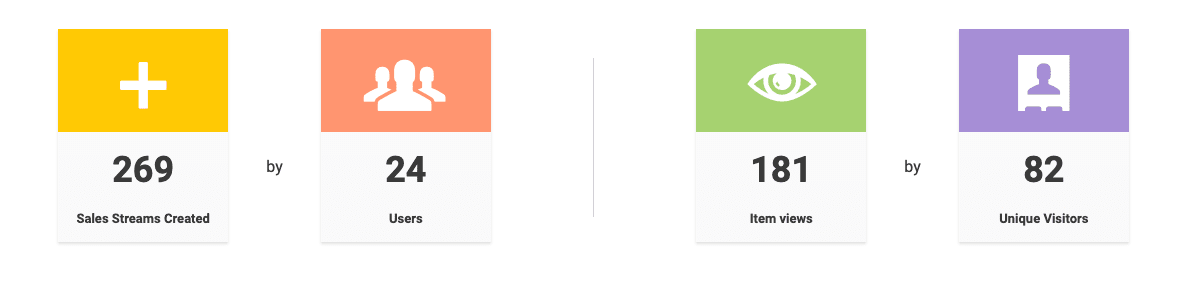
Four key metrics are highlighted at the top of the Sales Activity Dashboard, and are always visible. These provide an overview of how active Sales Reps have been in your Hub, and how prospects are engaging with the content they're sharing:
All data reflects the currently selected filters (i.e. the specific group or member and time range) and the current Hub.
The metrics shown are:
| Metric Name | Definition |
| Sales Streams Created | The total number of Sales Streams created in this Hub. |
| Users | The total number of users who created these Sales Streams. |
| Item Views | The total number of page views on all Items within these Sales Streams |
| Unique Visitors |
The total number of unique visitors (identified using a browser cookie) who generated these page views. Excludes visitors who only viewed a Sales Stream page, but did not click into an Item. |
User-Level Metrics
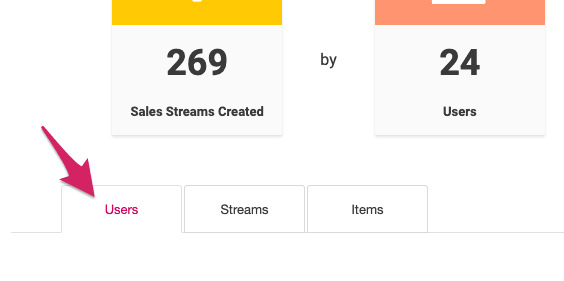
This category breaks down metrics by individual users, i.e. sales staff who are using the Uberflip for Sales tools. You can access it under the Users tab below the Overview metrics:
These metrics are shown in table form, and you can sort the table by any available metric by clicking on its column header (except for Current avg. Items / Stream).
All data reflects the currently selected filters (i.e. the specific group or member and time range) and the current Hub, with some exceptions as noted.
The metrics shown are:
| Metric Name | Definition | Notes |
| Current avg. Items / Stream |
The average number of Items contained in Sales Streams created by this user. |
This metric is real-time, and is not affected by the currently selected time range. |
| Streams Created | The total number of Sales Streams this user has created. | |
| Streams Shared | The total number of Sales Streams this user has shared using the Uberflip Extension. | |
| Streams w/ Item Views | The total number of Sales Streams created by this user which contain Items with at least one page view. | This metric is all-time, and is not limited to the currently selected time range. |
| Item Views | The total number of page views on Items in this user's Sales Streams. | |
| Unique Item Views | The total number of unique page views by unique visitors on Items in this user's Sales Streams. | Does not count repeated page views of the same item by a unique visitor. |
| Unique Visitors (U.V.) | The total number of unique visitors (identified using a browser cookie) who viewed Sales Streams shared by this user. |
Includes visitors who viewed the Stream page but did not click into an Item. |
| Avg. U.V. / Stream | The average number of Unique Visitors this user's Sales Streams have received. | Includes visitors who viewed the Stream page but did not click into an Item. |
| Avg. Unique Items Viewed / U.V. | The average number of Unique Item Views per Unique Visitor in this user's Sales Streams. | Excludes visitors who viewed the Stream page but did not click into an Item. |
Stream-Level Metrics
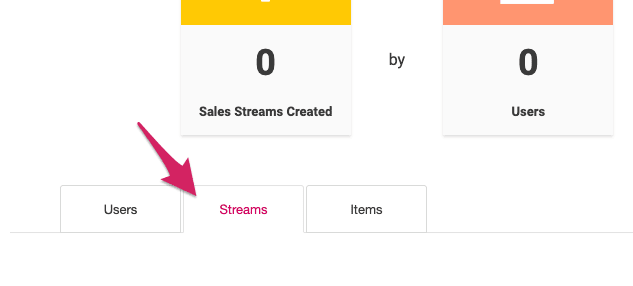
This category breaks down metrics by individual Sales Stream. You can access it under the Streams tab below the Overview metrics:
These metrics are shown in table form, and you can sort the table by any available metric by clicking on its column header.
All data reflects the currently selected filters (i.e. the specific group or member and time range) and the current Hub, with some exceptions as noted.
The metrics shown are:
| Metric Name | Definition | Notes |
| Current # of Items | The number of Items currently contained within this Sales Stream. | This metric is real-time, and is not affected by the currently selected time range. |
| Unique Visitors (U.V.) | The total number of unique visitors (identified using a browser cookie) who viewed this Sales Stream. | Includes visitors who viewed the Stream page but did not click into an Item. |
| Item Views | The total number of page views on Items in this Sales Stream. | |
| Unique Item Views | The total number of non-repeat page views by unique visitors on Items in this Sales Stream. | |
| Avg. Unique Item Views / U.V. | The average number of Unique Item Views per Unique Visitor in this user's Sales Streams. |
Item-Level Metrics
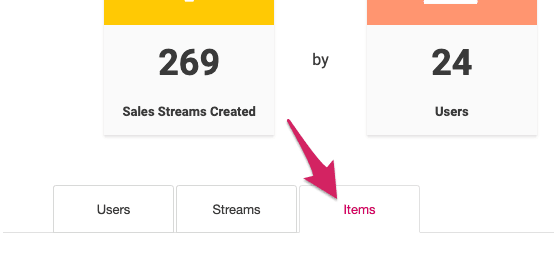
This category breaks down metrics by individual Item. This includes both Items that are contained within Sales Streams, as well as individual Items that have been shared via the Uberflip Extensions. You can access it under the Items tab below the Overview metrics:
These metrics are shown in table form, and you can sort the table by any available metric by clicking on its column header.
All data reflects the currently selected filters (i.e. the specific group or member and time range) and the current Hub, with some exceptions as noted.
The metrics shown are:
| Metric Name | Definition | Notes |
| Direct Shares | The total number of times this Item has been shared as a single Tile only using the Uberflip Extensions. | |
| Indirect Shares | The total number of times this Item has been shared as part of a Sales Stream using the Uberflip Extensions. | |
| Shares | The total number of Direct and Indirect Shares of this Item. | |
| Unique Visitors | The total number of unique visitors (identified using a browser cookie) who viewed this Item. | |
| Views | The total number of (non-unique) page views on this Item when it has been shared on Sales Streams. | Does not count page views on the Item outside the context of a Sales Stream, i.e. views of the Item when shared as a single Tile. |
Notes
- Sales Activity Dashboard metrics are updated once every 24 hours (i.e. they are not updated in real time).